Fixing C# Debugging in Visual Studio Code on macOS
July 08, 2023 - 3 min read (472 words)
Quite painfully, the VS Code ms-dotnettools.csharp
extension
debugger binaries do not work out-of-the-box on modern macOS
versions (v12+). This article outlines
the steps that are necessary to get those debugger binaries working macOS Monterey
and beyond.
I revisit this thread more frequently than I visit my in-laws. The resigning works, but it’s just a pain. (superman-lopez)
The unresolved issue is documented on GitHub and the solution can be found there. This post pulls together a digest of the solution and the related links found in that thread.
Table of Contents
Generate a Code Signing Certificate
In a one-time step, a new local self-signed certificate needs to be created for the purpose of code signing the debugger binaries used by VS Code. This certificate may be used again when the binaries are changed by to new versions when the VS Code extension updates while the steps below must be repeated for each extension update.
These steps were pulled from this Stack Overflow Answer.
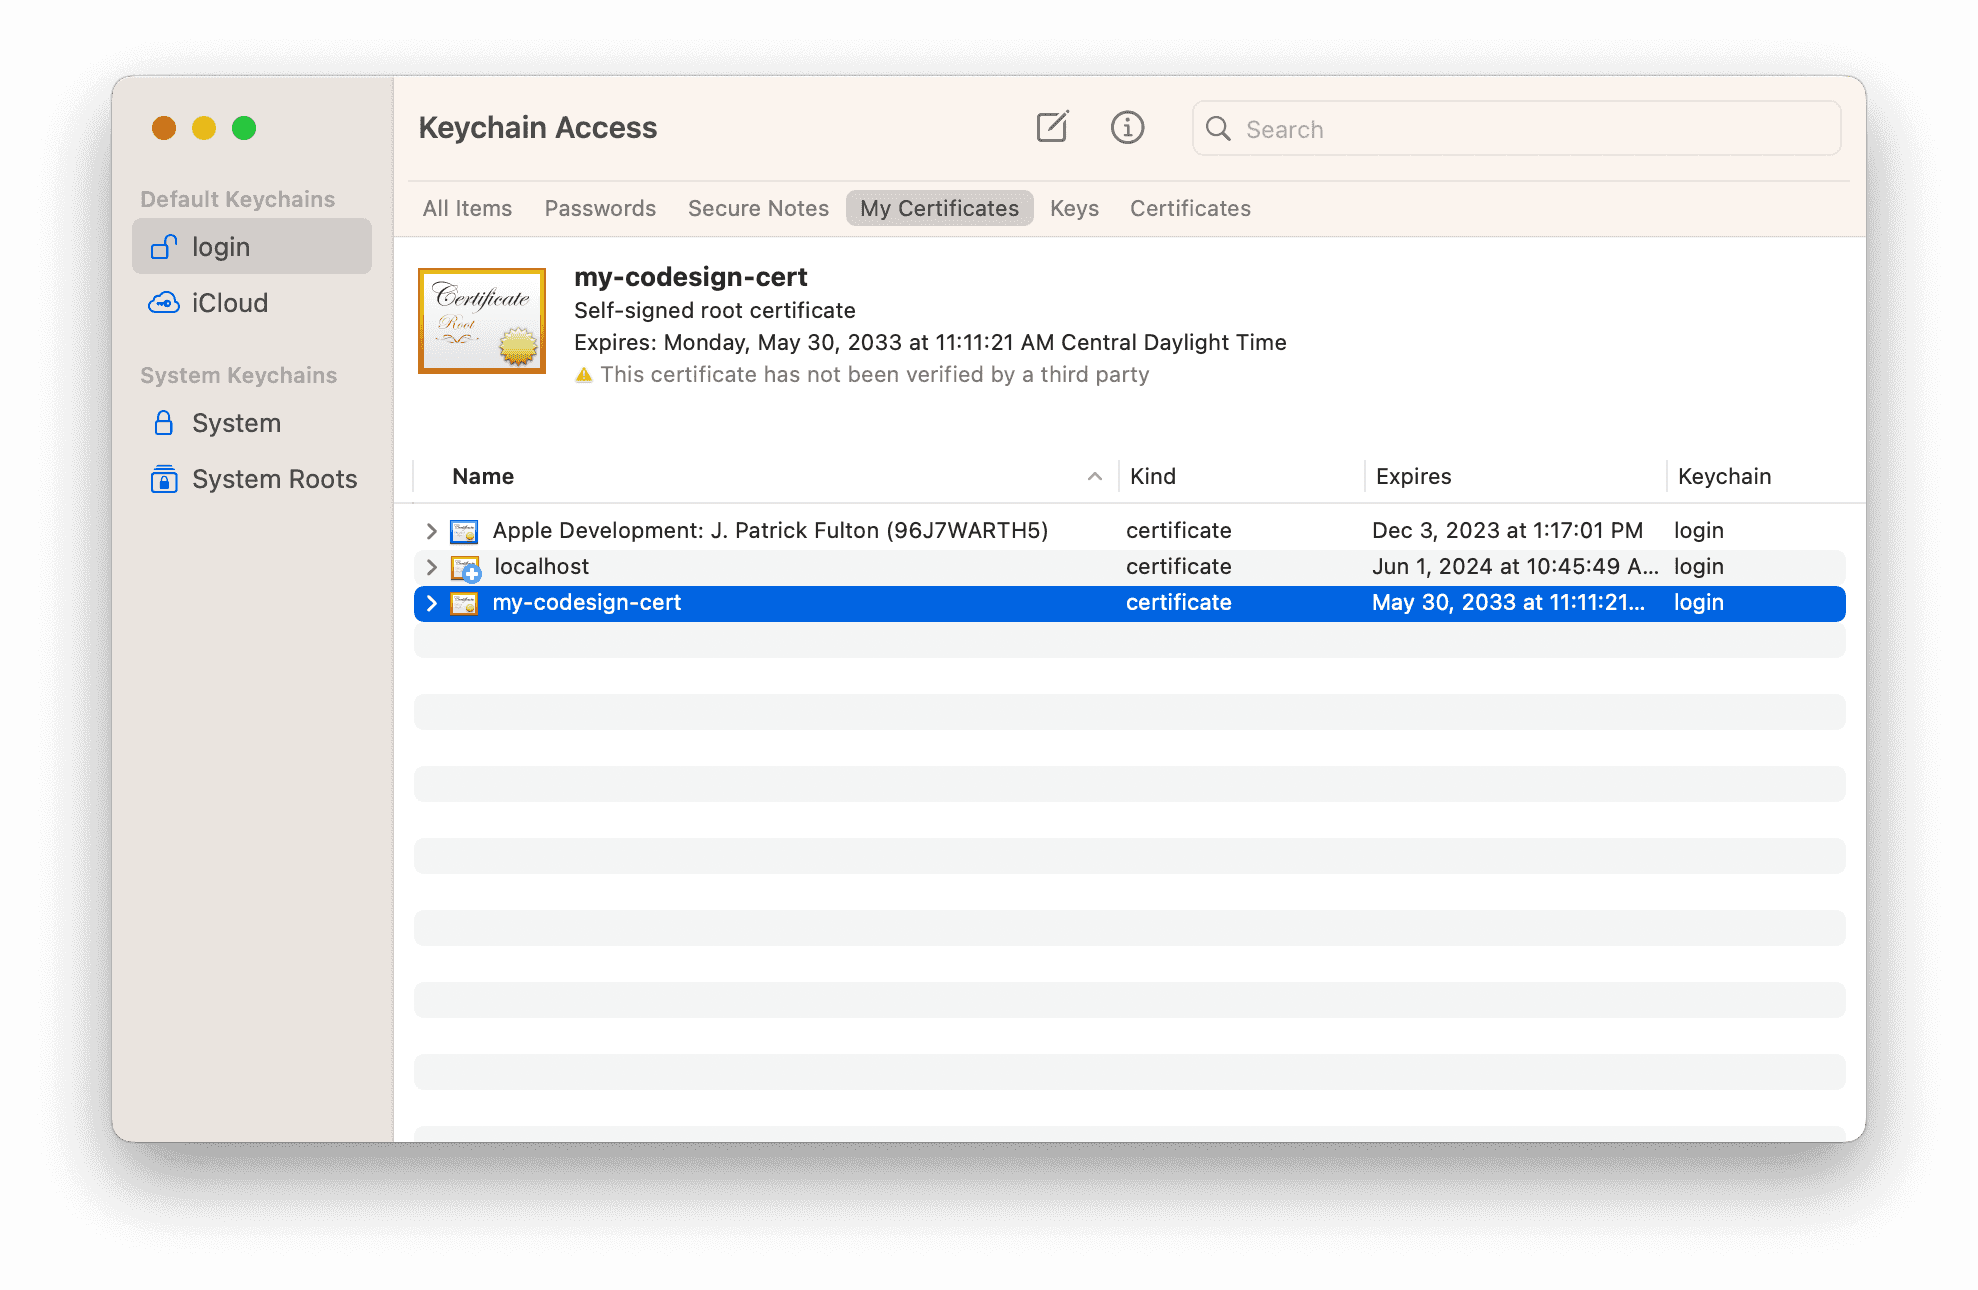
Open Keychain Access
In a terminal, run open -a "Keychain Access" to open the Keychain Access utility.
Run the Certificate Assistant
From the Keychain Access menu, select Certificate Assistant > Create a Certificate to open the assistant dialog.
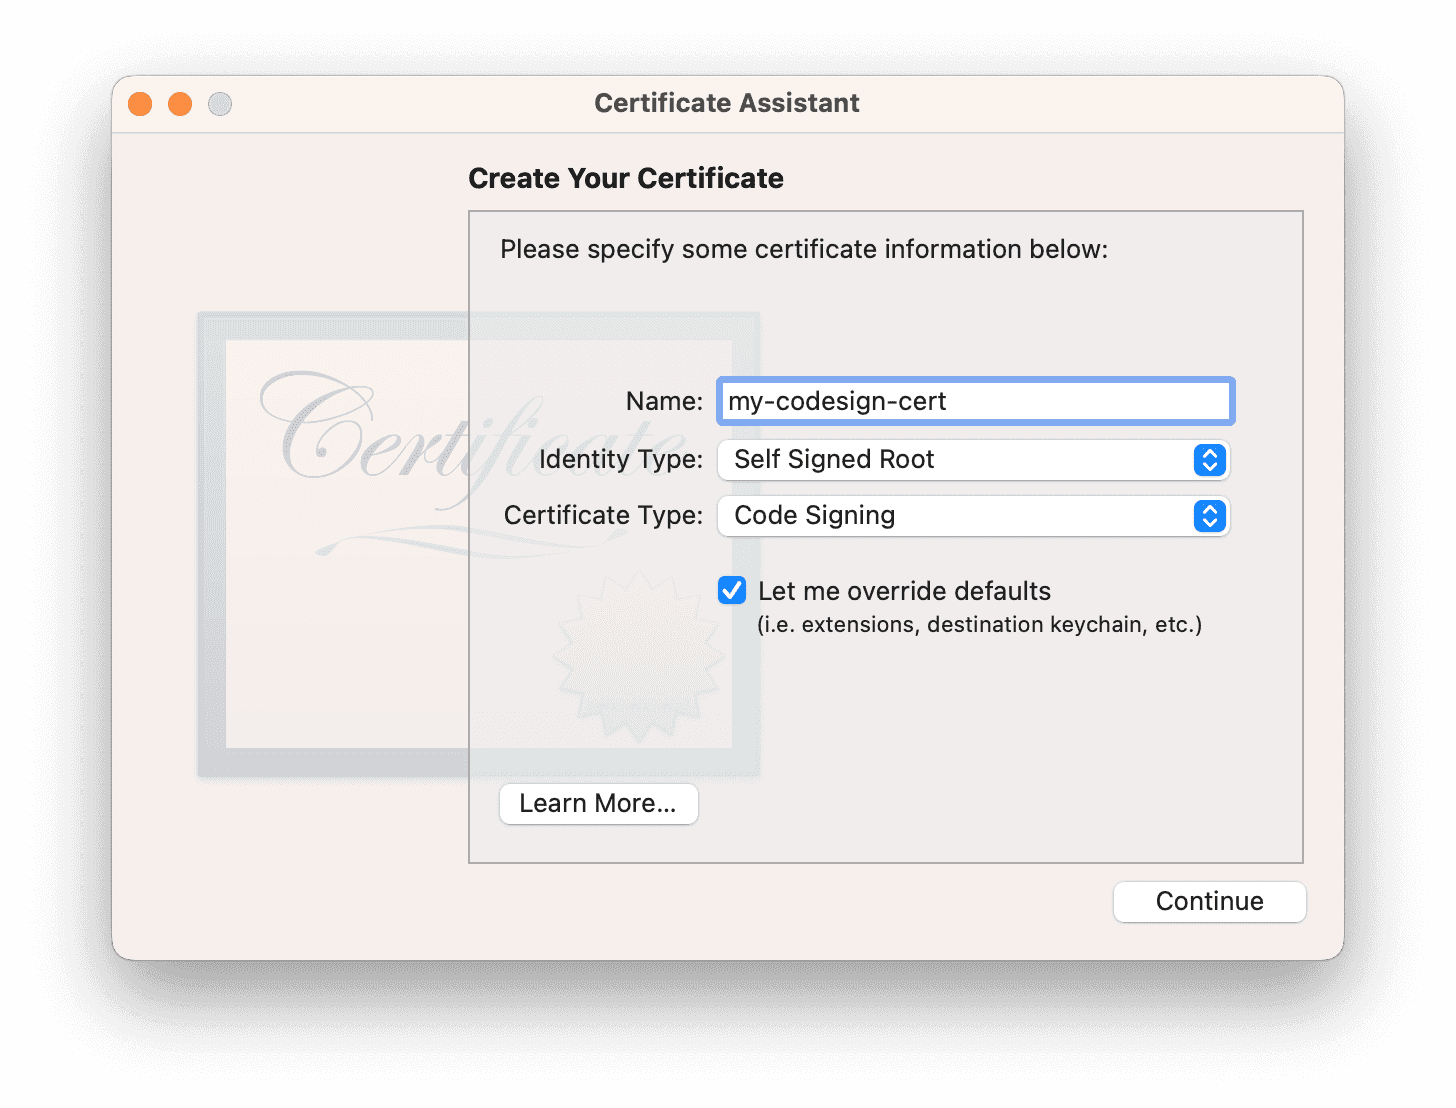
Generate a Self-Signed Certificate for Code Signing
Follow the steps in the assistant with the following steps:
- Enter the Name (for example
my-codesign-cert) - Identity Type > Self Signed Root
- Certificate Type > Code Signing
- Check “Let me override defaults” & click Continue.
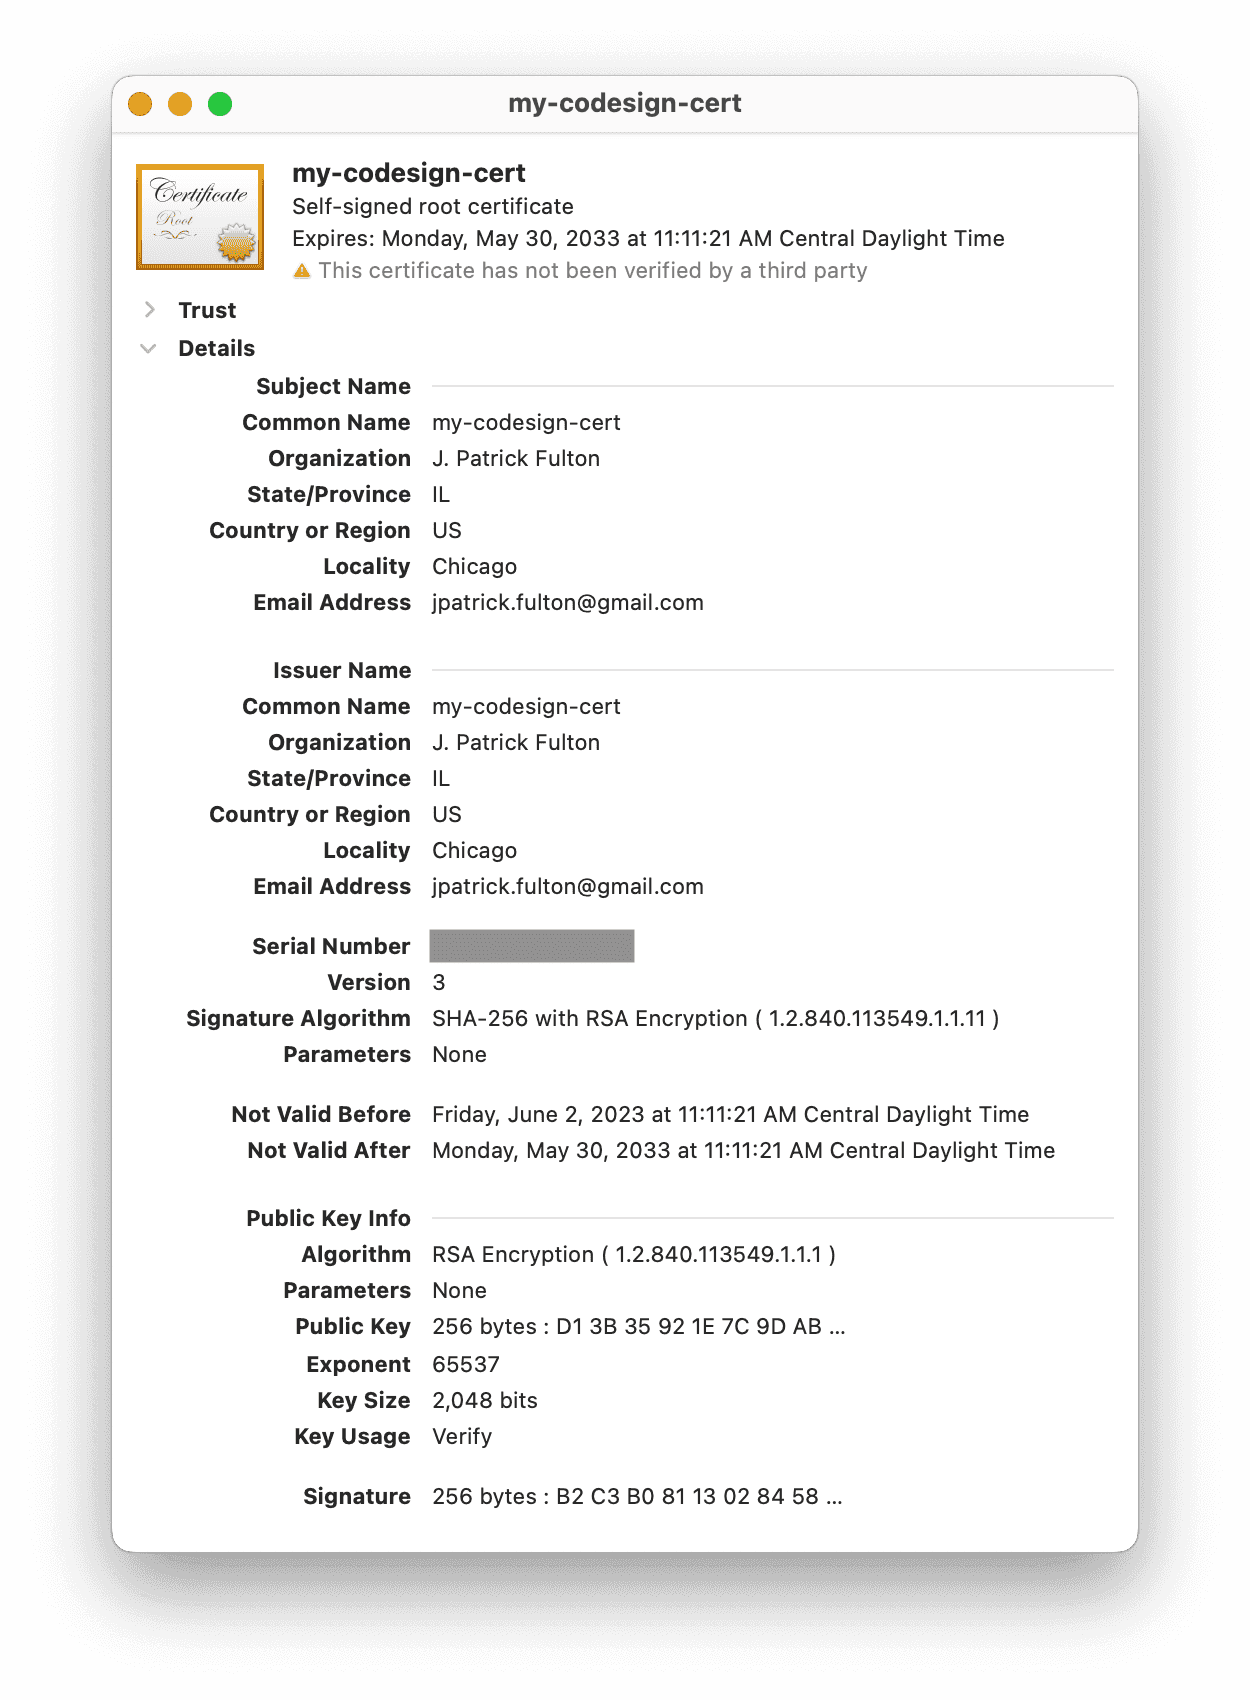
- Enter a unique Serial Number.
- Enter a Validity Period (days), like
3560& click Continue. - Fill in your personal information & click Continue.
- Accept defaults for the rest of the dialog boxes.
Re-sign the VS Code C# Debugger Binaries
The ms-dotnettools.csharp VS Code extension packages two binaries used in the
debugging process: vsdbg and vsdbg-ui. These binaries need to signed with
the certificate generated above. The first step is to identify the directory
where these binaries are currently located. This directory changes between
installed versions of the extension and these steps need to be run
every time the extension is updated by VS Code.
Run the following commands to find the current location of these files:
cd ~/.vscode/extensions/
cd ls | grep ms-dotnettools.csharp
ms-dotnettools.csharp-1.26.0-darwin-x64
cd ms-dotnettools.csharp-1.26.0-darwin-x64/.debugger/x86_64/
In my case and at the time of this writing, the full path to the directory is
/Users/josephpfulton/.vscode/extensions/ms-dotnettools.csharp-1.26.0-darwin-x64/.debugger/x86_64.
Run the following command to remove the existing signature from that binaries:
codesign --remove-signature vsdbg-ui && codesign --remove-signature vsdbg
Next, run this command to sign the binaries with the self-signed certificate:
codesign -s my-codesign-cert vsdbg-ui && codesign -s my-codesign-cert vsdbg
Using VS Code, the debugger should now remain attached to C# processes and correctly hit breakpoints set there.

Written by J. Patrick Fulton.