Visual Studio Code Support and Debugging for a Gatsby Project
July 03, 2023 - 7 min read (1317 words)
Despite being a long-term and professional user of the full version of Visual Studio, Visual Studio Code quickly became my IDE of choice. It is light weight, cross platform and has an exceptional extension ecosystem.
Visual Studio Code, also commonly referred to as VS Code, is a source-code editor made by Microsoft with the Electron Framework, for Windows, Linux and macOS. Features include support for debugging, syntax highlighting, intelligent code completion, snippets, code refactoring, and embedded Git. (Wikipedia)
When I started working on this blog and implemented it in Gatsby, it was important to develop good support in the project for VS Code and to be able to effectively debug issues as they arose and edit content using that tool.
The evolving GitHub repository storing this blog and its implementation can be found here.
Table of Contents
The .vscode Folder
The .vscode directory is generally found at the root of a
mulit-repo pattern. In a
mono-repo pattern, it can be found
or extended in the root folder for each sub-project. Details on the files
commonly found there are documented in this
article.
In the GitHub repository storing this blog implementation, the directory can be found here.
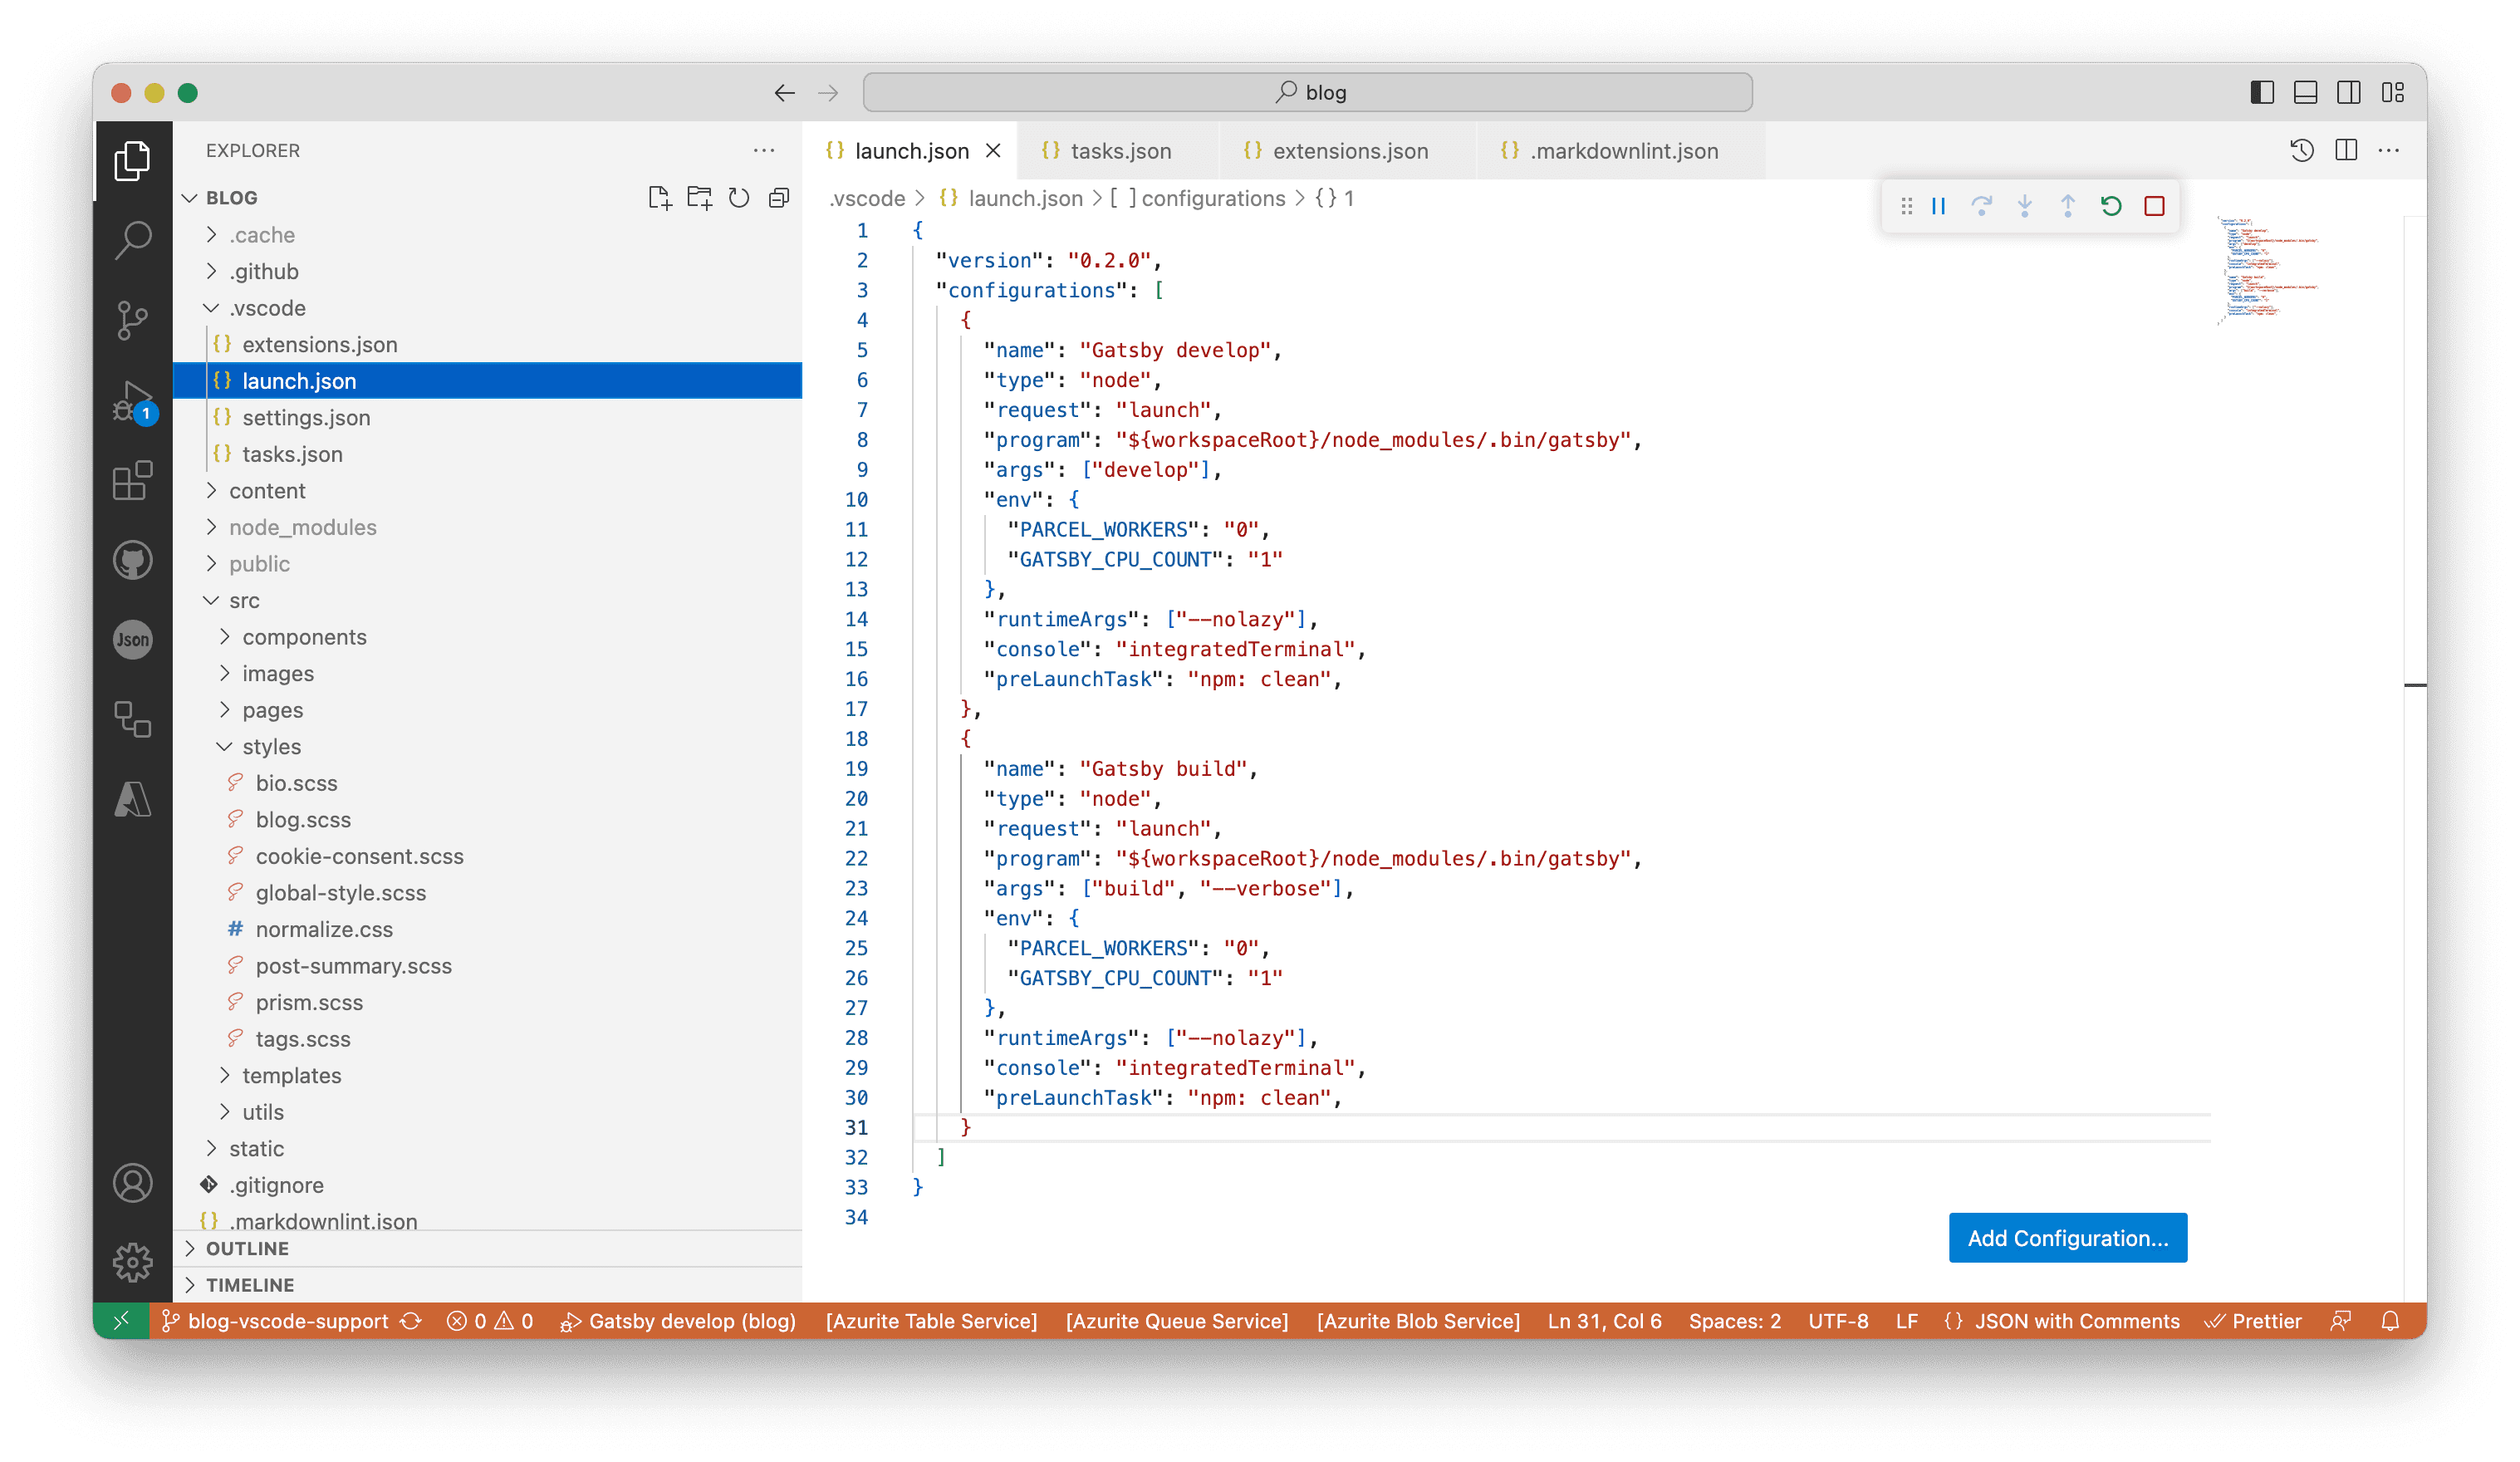
The launch.json File
The launch.json file controls the Run and
Debug functions in VS Code.
Gatsby offers a guide to debugging in VS Code. I adapted its suggestions with some modification here. For example, I utilize a prelaunch task to ensure a clean prior to running either a build or develop command.
There are some notable elements in this file. Firstly, through environment
variables, the normal multithreading of Gatsby is limited to make debugging
easier. Secondly, --nolazy is passed to the Node runtime ease breakpoint
setting per the VS Code
documentation.
For performance reasons Node.js parses the functions inside JavaScript files lazily on first access. As a consequence, breakpoints don’t work in source code areas that haven’t been seen (parsed) by Node.js.
{
  "version": "0.2.0",
  "configurations": [
    {
      "name": "Gatsby develop",
      "type": "node",
      "request": "launch",
      "program": "${workspaceRoot}/node_modules/.bin/gatsby",
      "args": ["develop"],
      "env": {
        "PARCEL_WORKERS": "0",
        "GATSBY_CPU_COUNT": "1"
      },
      "runtimeArgs": ["--nolazy"],
      "console": "integratedTerminal",
      "preLaunchTask": "npm: clean",    },
    {
      "name": "Gatsby build",
      "type": "node",
      "request": "launch",
      "program": "${workspaceRoot}/node_modules/.bin/gatsby",
      "args": ["build", "--verbose"],
      "env": {
        "PARCEL_WORKERS": "0",
        "GATSBY_CPU_COUNT": "1"
      },
      "runtimeArgs": ["--nolazy"],
      "console": "integratedTerminal",
      "preLaunchTask": "npm: clean",    }
  ]
}
The tasks.json File
The tasks.json file controls
integration with external tools.
These tools are mostly run from the command line and automate jobs inside and outside the inner software development loop (edit, compile, test, and debug). Given their importance in the development life cycle, it is helpful to be able to run tools and analyze their results from within VS Code.
Here I integrated the clean script from package.json as a task so that it could
be used as a prelaunch task in launch.json as highlighted above.
{
    "version": "2.0.0",
    "tasks": [
      {
        "type": "npm",
        "script": "clean",
        "isBackground": true,
        "problemMatcher": {
          "owner": "typescript",
          "pattern": "$tsc",
          "background": {
            "activeOnStart": true,
            "beginsPattern": {
              "regexp": "(.*?)"
            },
            "endsPattern": {
              "regexp": "Successfully deleted directories"
            }
          }
        }
      },
    ],
}
The settings.json File
The settings.json file defines project level
settings that
apply specifically to the open workspace.
Here I have specified prettier as the default code formatter and provided
several editor settings that apply to it.
{
  "editor.tabSize": 4,
  "editor.formatOnSave": true,
  "editor.codeActionsOnSave": [
    "source.fixAll",
    "source.organizeImports",
    "source.sortMembers"
  ],
  "editor.defaultFormatter": "esbenp.prettier-vscode"
}
Recommended Extensions in Use
The extensions.json file includes a series of recommended VS Code extensions
for the project.
The extensions.json File
To make things super easy, the extensions.json file in the .vscode directory
includes the keys for each extension and integrates with the IDE to make the suggestions
upon opening the repository.
{
    "recommendations": [
        "davidanson.vscode-markdownlint",
        "esbenp.prettier-vscode",
        "github.vscode-github-actions",
        "github.vscode-pull-request-github",
        "zainchen.json",
    ]
}
Using the VS Code Markdownlint Extension
When building this implementation, I went to a great deal of trouble to use the
gatsby-plugin-mdx plugin
to make authoring content in markdown with extensions for
React components
a first class citizen in the project. My extension of choice for markdown editing
and linting in VS Code is davidanson.vscode-markdownlint. However, I was unable
to find settings for it that would extend its use to .mdx files. Technically, the
markdown that powers this blog is MDX though leaving the files with a .md file
extension allows that VS Code plugin to do its magic. As a result, I simply modified
the options of the gatsby-plugin-mdx plugin to look for .md files as well.
{
  resolve: `gatsby-plugin-mdx`,
  options: {
    extensions: [`.mdx`, `.md`],    ...
  },
},
Traditional markdown files disallow inline HTML tags and the linter has a rule
to enforce this: MD033. MDX file, on the other hand, needs what looks like
inline HTML tags to allow React components to be included. As a result, I
created a .markdownlint.json file at the root of the project to configure
the linter extension to ignore that rule.
{
  "MD033": false
}
Using the VS Code Prettier Extension
Per the settings.json file, the Prettier extension is set as the default code
formatter for the project. On file save, it is configured to work its magic:
correcting quality problems, reformatting tabs, organizing imports and sorting
members. In combination with the format script in the package.json file,
this makes things fairly easy to maintain nice code quality for the project.
I am a big fan of the import organization feature. However, use caution
with it on certain files. For example, in the gatsby-browser.js
file,
unlike most sets of import statements, order matters here. If you are not paying
attention, the Prettier plugin can reorder your
CSS and SASS
imports in way creates unexpected styling behaviors.
Pro Tip: Prettier will alphabetize and organize import statements within groups. The behavior can be controlled by separating groups of import statements with either new lines or comments.
// normalize CSS across browsers
import "./src/styles/normalize.css";

// global styles
import "./src/styles/global-style.scss";

// prismjs highlighting theme for code blocks
import "prismjs/themes/prism-coy.css";
// prismjs highlighting plugins for code blocks
import "prismjs/plugins/command-line/prism-command-line.css";
import "prismjs/plugins/line-numbers/prism-line-numbers.css";

// custom component and page level styles
import "./src/styles/bio.scss";
import "./src/styles/blog.scss";
import "./src/styles/cookie-consent.scss";
import "./src/styles/post-summary.scss";
import "./src/styles/prism.scss";
import "./src/styles/tags.scss";
Debugging Gatsby with VS Code
With the VS Code support files in place, most elements of the Gatsby build
process and develop mode runs can be debugged with standard features in the IDE.
From the Run and Debug tab, Gatsby can be launched in either develop or build
mode and breakpoints set. This works for nearly all cases.
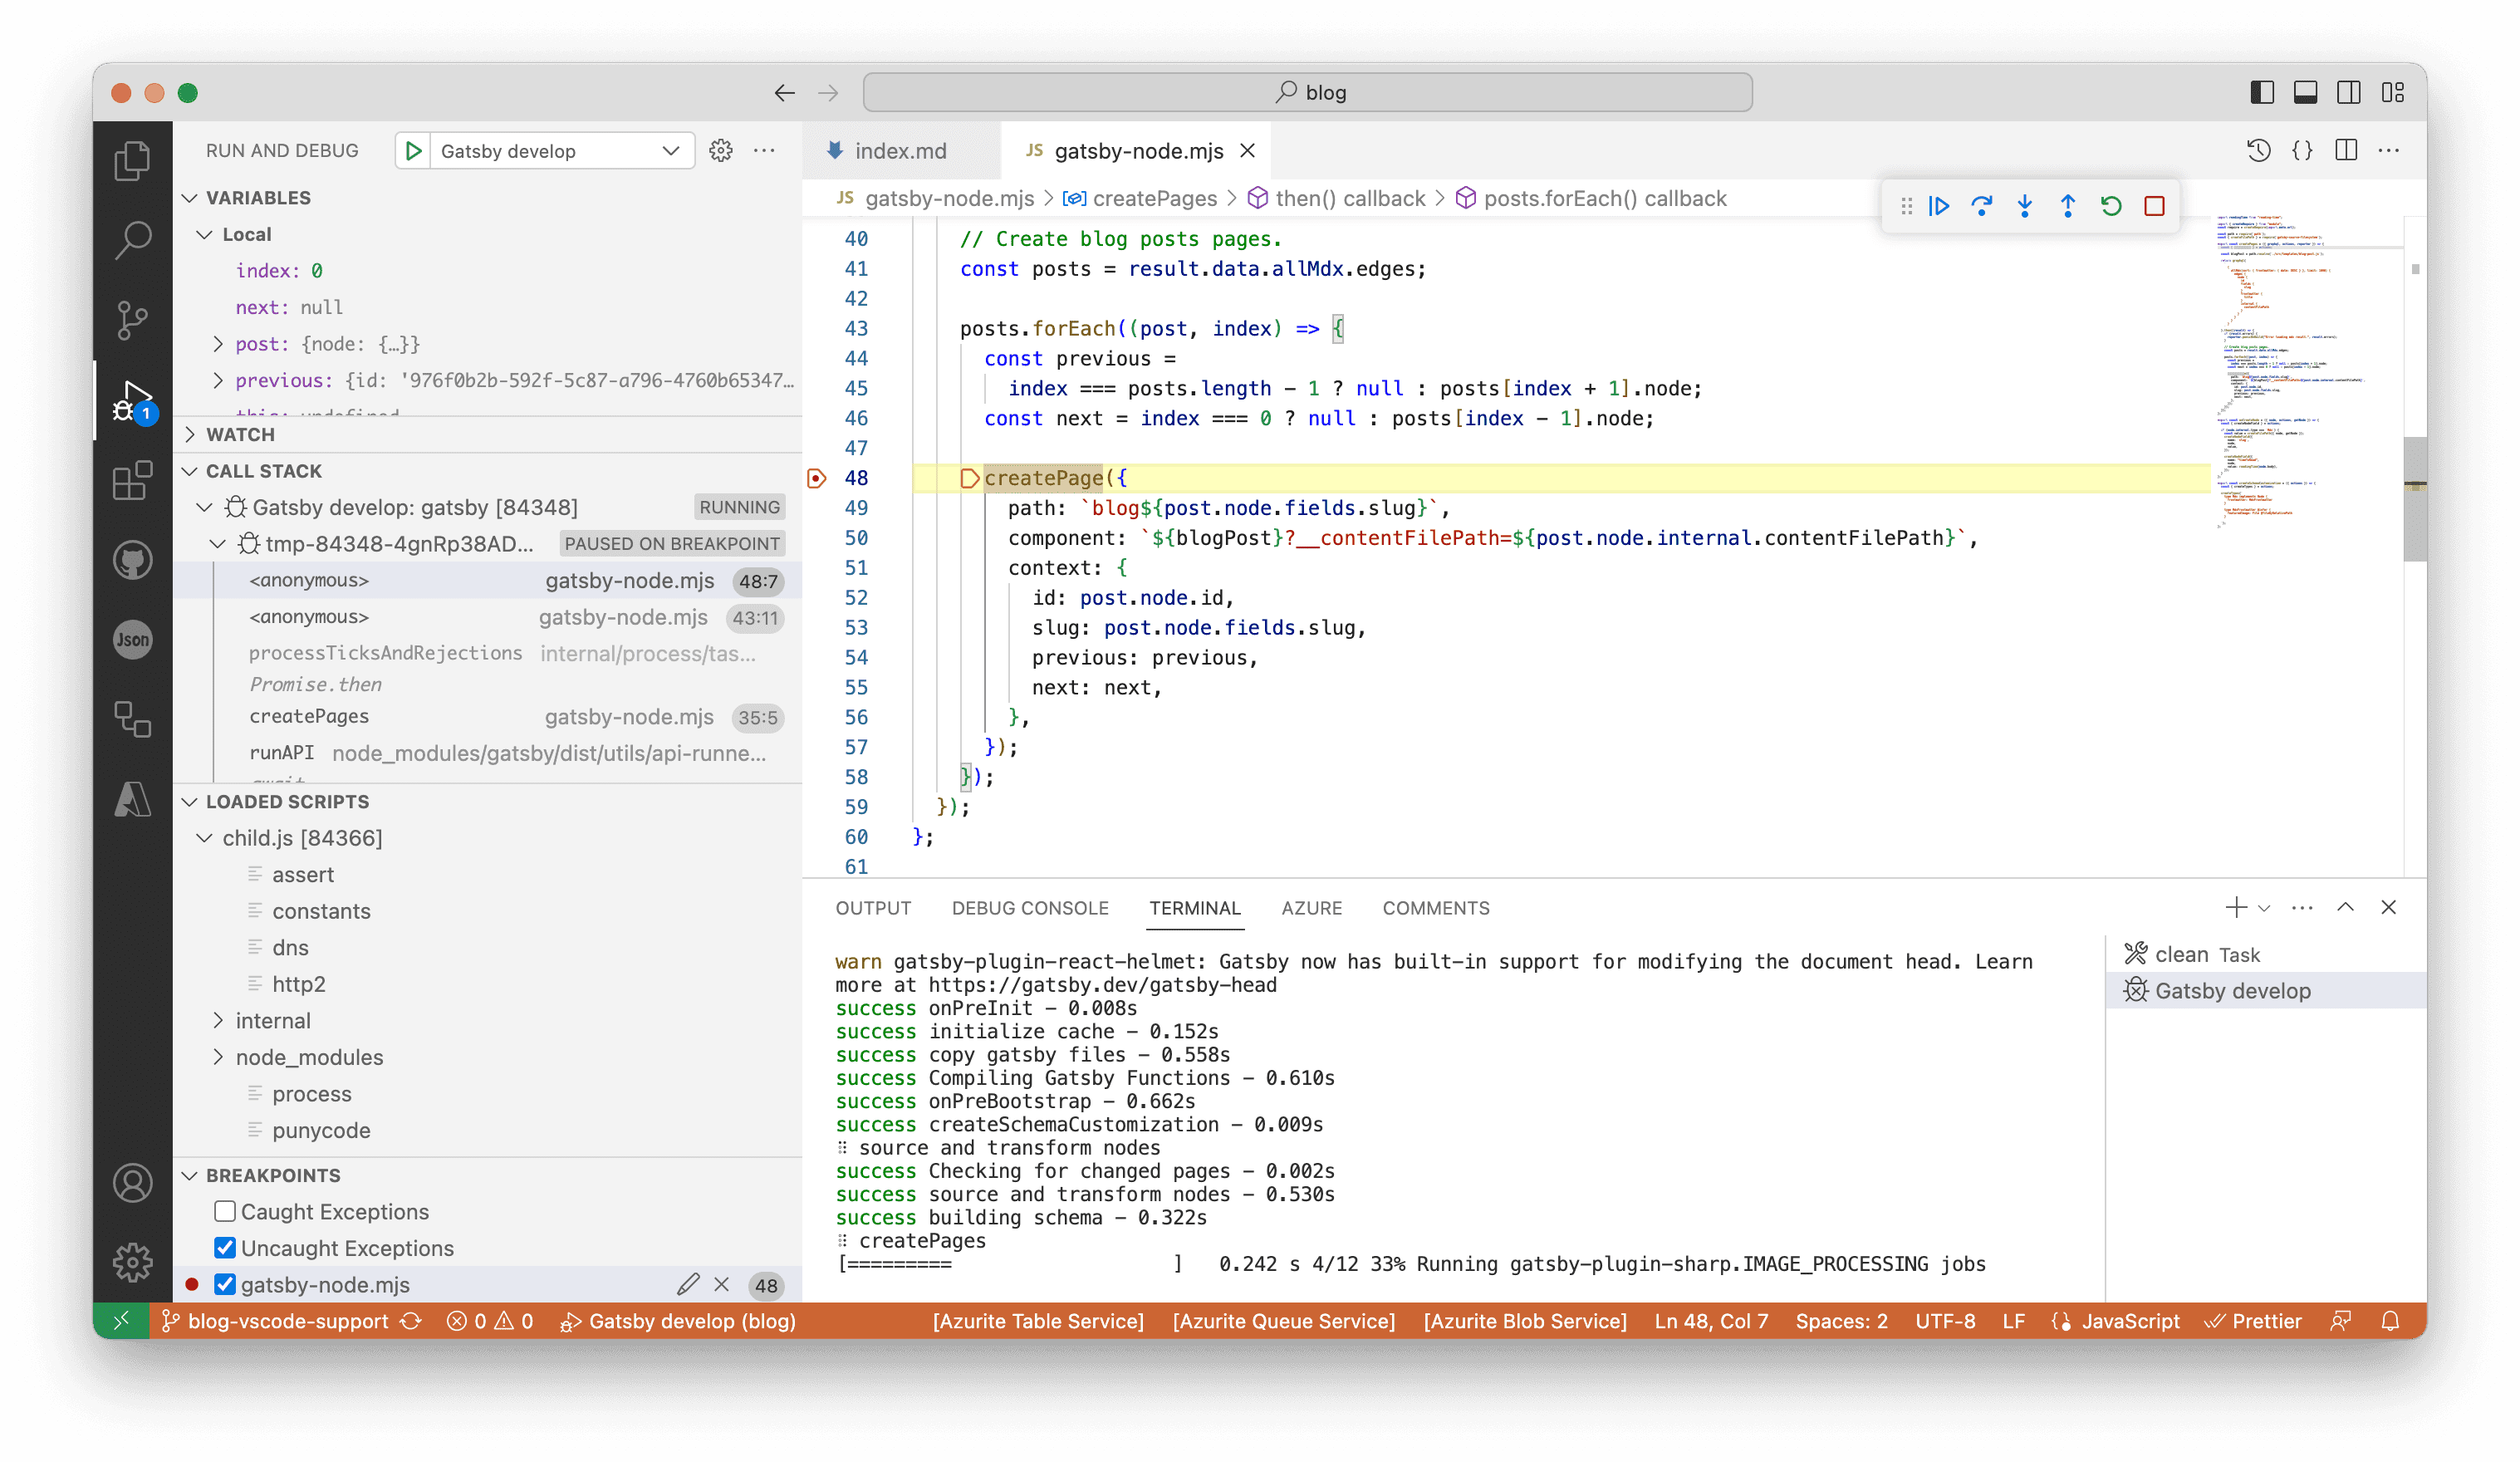
Outstanding Debugging Issues
The main debugging issue that I have uncovered working with this setup on the project is the inability to set breakpoints in templates loaded by the createPages method in the Gatsby Node API using the createPage action. These templates are loaded dynamically at runtime from a path. As such, the debugger has no access to them and debugging must be performed from the Gatsby error messages. I have yet to find a workaround which would very much come in handy when building new features.
export const createPages = ({ graphql, actions, reporter }) => {
  const { createPage } = actions;

  const blogPost = path.resolve(`./src/templates/blog-post.js`);  ...
  posts.forEach((post, index) => {
      const previous =
        index === posts.length - 1 ? null : posts[index + 1].node;
      const next = index === 0 ? null : posts[index - 1].node;

      createPage({
        path: `blog${post.node.fields.slug}`,
        component: `${blogPost}?__contentFilePath=${post.node.internal.contentFilePath}`,        context: {
          id: post.node.id,
          slug: post.node.fields.slug,
          previous: previous,
          next: next,
        },
      });
    });
  ...
Written by J. Patrick Fulton.